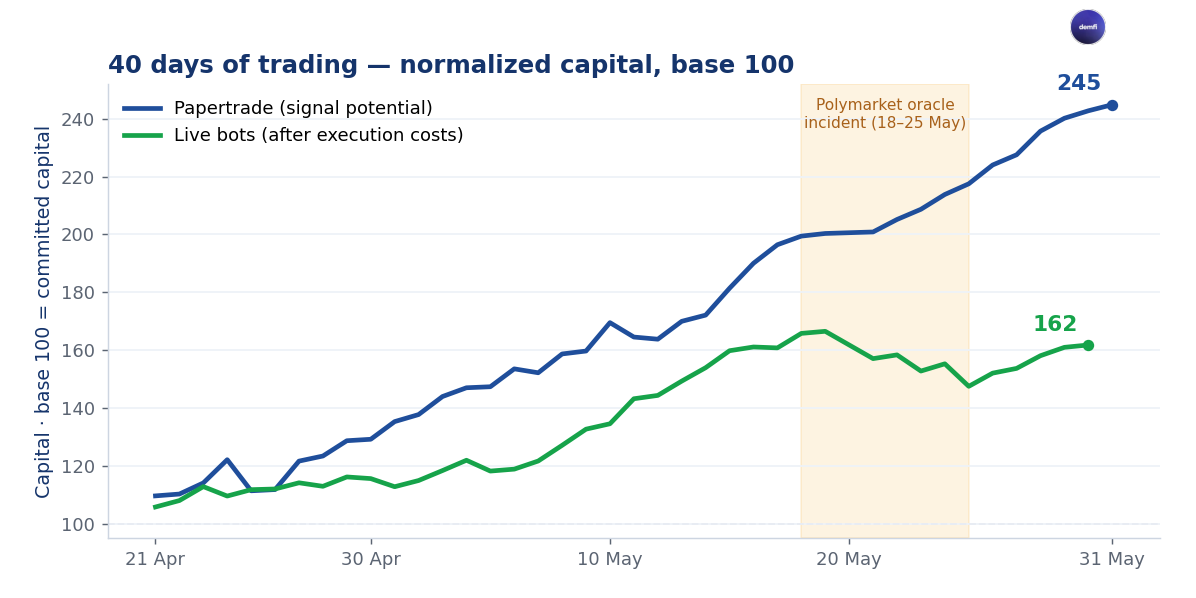
Over forty days of live trading, we won a little more than one bet out of two. 55%. In paper trading, even fewer: 42%. And yet, over the same period, committed capital grew by +62% live and +145% in simulation.
This isn't a contradiction. It's the whole point of this final episode: on Polymarket Weather, what drives the result isn't the win rate. It's the process — and the lab where we validate it before risking a single cent.
The detail is public, day by day, city by city, at demfi.io/en/track-record — with, for anyone who wants the full reasoning, the investor report PDF right on the page.
The lab before the money
At DEMFI, no parameter reaches our live bots without first running for weeks in simulation. Kelly fractions, slippage thresholds, exit rules: everything is replayed on real data, in paper trading, before a dollar is committed. Both systems read exactly the same signal — same model, same confidence, same edge. What changes is execution.
That's the key to reading the curve above. Paper trading (in blue) measures the signal's potential: it buys at the quoted price, frictionless. The live bots (in green) measure reality after execution costs. The gap between the two curves isn't a flaw — it's the price of real money.
What 40 days show
36 positive days out of 40 in simulation, 30 out of 39 live. 3,227 simulated bets, 1,261 real ones. But the average tells you nothing useful — you have to look strategy by strategy.
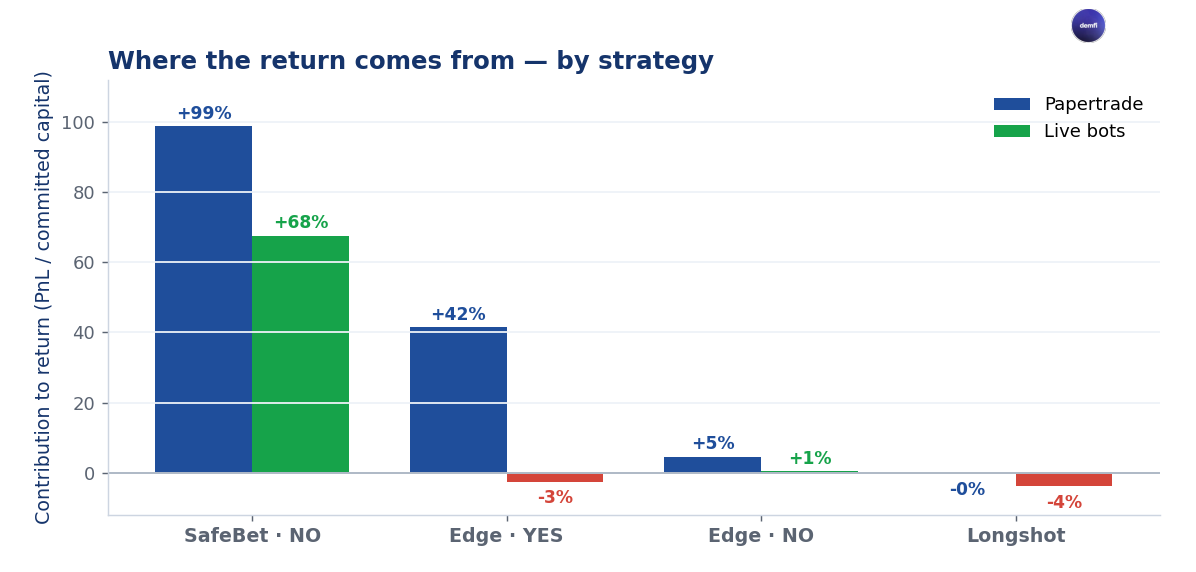
The Safebet is the engine: on its own, +99% of the return in paper, +68% live. That's consistent with this whole series — buying NO expensive on a bucket physics has already ruled out means winning often, a little at a time, with low volatility. Edge YES is the second engine in simulation (+42%), but nearly flat live (−3%). Edge NO stays marginal, and Longshot ends around zero, slightly negative.
Why live stays below simulation
That gap, +145% versus +62%, is the most instructive part — and the most honest.
Paper trading ignores slippage; live pays it. When you buy on Polymarket, your order moves the price: the theoretical margin erodes as you walk the order book. Our safeguard, the slippage gate, scales the order size down in a cascade until the edge survives the fill — or cancels the trade. That's what kept live profitable.
It's also what explains Edge YES live: the buckets it targets are thin, so the cascade often had to shrink the size, sometimes to zero. And it's why Longshot was retired live: on 2-cent tickets, slippage ate the entire margin. The orange band on the curve marks the Polymarket oracle incident of 18–25 May — an outage suffered, not a signal error.
How to read these numbers
The trap would be to conclude that with a 42% win rate you shouldn't be making money. That's exactly the mistake this series has fought since episode one.
Winning here isn't about finding the right bet. It's about holding, every day and across dozens of independent cities, a coherent combination of positions — Safebets that win often and small, Longshots that lose often but can pay a hundred times, all sized as a fraction of Kelly. Diversity makes the result; sizing protects the margin. The win rate only tells half the story.
What closes this series
From "this isn't a roulette" to "four strategies, one process," the thread has always been the same: the difference isn't luck, it's discipline. The lab — paper trading — is where that discipline lives, gets tested, and gets corrected before it costs anything.
The numbers above guarantee nothing about what comes next, and nothing here is financial advice. But they're true, verifiable, and published in full.
Connect your wallet at demfi.io/en — you get 2 credits on your first connection (1 credit = one city for one day). Watch the four alert streams on your cities, read the full track record, and download the report. Then decide, with the real data in front of you.
Good analysis,
— JP